


-
 Unlimited Activations
-
 Instant delivery
-
 Free Update
Advanced Supply Demand Indicator: Optimize Your Trading with Precision
This indicator is based on the mathematics of the great trader W.D. Gann. With its help, you can easily find strong levels by analyzing swings to find the optimal entry point. Moreover, the indicator works on all instruments and all timeframes. Additionally, it is fully manual and has control buttons.
For instance, all you need to do is press the NEW button, and a segment will appear. You can place this segment on any movement, swing, or even one candle that you want to analyze.
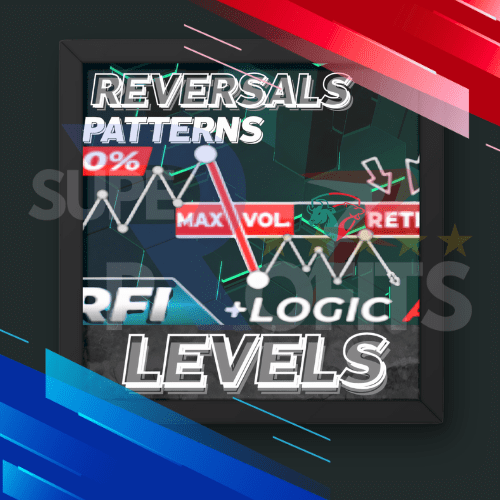
After placing the segment and pressing the OK button, a grid (with adjustable parameters) will appear inside it. The percentage shown on this grid indicates the likelihood of a reversal or correction. Therefore, the work is based on analyzing levels.
Why Use the Gann Swing Indicator?
The Gann Swing Indicator stands out for its simplicity and effectiveness. By utilizing the mathematics developed by W.D. Gann, this tool provides traders with a robust method to identify key market levels. It works across all timeframes and instruments, offering unparalleled flexibility.
Additionally, this indicator is fully manual, giving traders complete control over their analysis. Furthermore, the intuitive control buttons make it easy to mark and analyze market movements. As a result, this helps you make more informed trading decisions.
Key Features of the Gann Swing Indicator
- Based on W.D. Gann’s mathematical principles
- Works on all instruments and timeframes
- Fully manual with intuitive control buttons
- Adjustable grid and percentage parameters
- Identifies high-probability reversal and correction levels
How to Use the Gann Swing Indicator
To use the Gann Swing Indicator effectively, follow these steps:
- First, load the M1 history before starting.
- Next, press the NEW button to create a segment.
- Then, place the segment on any movement, swing, or candle you wish to analyze.
- After that, press the OK button to generate the grid within the segment.
- Finally, adjust the grid and percentage parameters as needed to identify key levels.
Important Note
Before using it, make sure to load the M1 history.
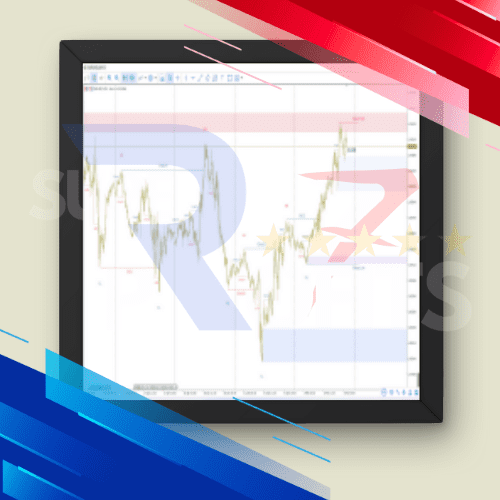
Visual Insights and Demonstration

Product Specifications
| Specification | Description |
|---|---|
| Indicator Type | Manual |
| Applicable Markets | All instruments |
| Timeframes Supported | All timeframes |
| Key Function | Identifies strong levels for reversal or correction |
| Control Buttons | NEW, OK |
| Adjustable Parameters | Grid and percentage levels |
In summary, the Advanced Supply Demand Indicator is a vital tool for traders seeking precision in market analysis. Its flexibility and ease of use make it suitable for analyzing any market movement across all timeframes. Consequently, with this indicator, you can gain a deeper understanding of market levels and improve your trading strategy. Therefore, this tool is essential for anyone serious about trading.
 Recommendations
Related Products

Reviews
Clear filtersThere are no reviews yet.